Climate Criminal (Ethan's Version)
Inspired by Taylor Swift, I’m tracking my flights ✈️–and the resulting carbon footprint–over the past year.
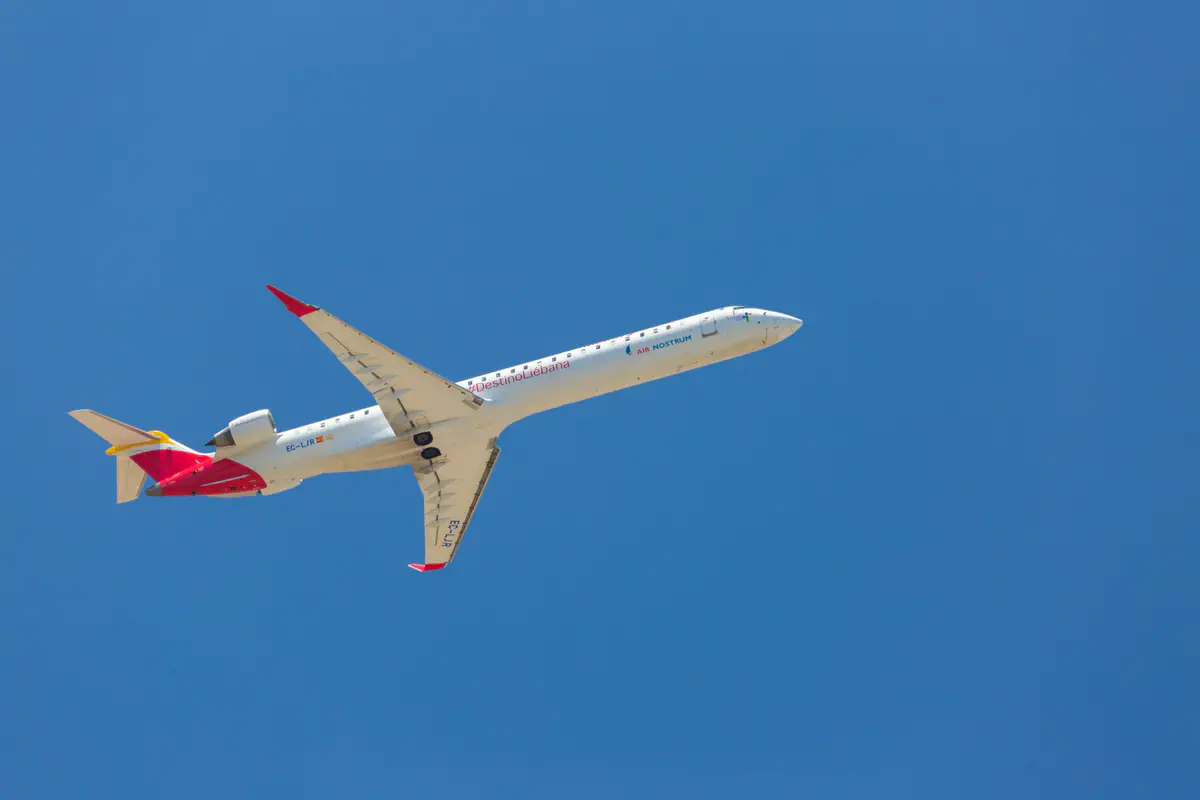 Image credit: Petr Kratochvil
Introduction
This July, pop singer Taylor Swift was lampooned online for her lavish use of her private jet. The British digital consultancy Yard, in an unscientific yet revealing article, found that Swift flew 170 times over seven months, contributing 8,294 metric tons of carbon dioxide to the atmosphere. To put that in context, that’s 1,185 times more than the average person emits in one year.
In response to the resulting outcry, Swift’s team clarified that her jet is often loaned to others, diluting her personal contribution. However, the thesis of the analysis still stands: aviation contributes a staggeringly high proportion of individual carbon emissions. Globally, air travel accounts for about 3% of carbon emissions, with signficantly higher emissions per kilometer than car, rail, or bus travel. Furthermore, those emissions are concentrated among the small group of people who can afford to fly. In a recent Gallup survey, 62% of Americans reported that they hadn’t taken a plane at all in the past year. Once we expand our scope internationally, the comparison becomes even worse. A single transatlantic trip contributes more emissions than the total annual emissions of an average citizen in 56 countries.
My travel
Inspired by the discourse around Swift’s travel, I decided to examine my own flights from the past year, from September 2021, when I left home for college, to the present. Most of my trips during this period were short domestic flights, but I’ve also taken two trips to London during this time. Using the tmap package in R, I made a video to document these trips:
In total, I took 23 flights (including one connecting flight), traveling 52,249 km.1 That’s enough to circumnavigate the globe! Of those flights:
- 10 were weekend trips to APDA tournaments on the Eastern seaboard, accounting for 9,084 km (17.4%)
- 7 were for career programs sponsored by external organizations, accounting for 29,089 km (55.7%)
- 6 were between UChicago and my home in Houston, accounting for 14,076 km (26.9%)
Using a quick back-of-the-envelope calculation (with this chart), I found that this flight distance translates to 11.7 metric tons of carbon emssions.2 Per the EPA’s carbon footprint calculator, which accounts for home, vehicle, and waste emissions, my carbon footprint from other sources is 12.7 metric tons annually, meaning that air travel has produced roughly half of my personal emissions over the past year.
Takeaways
- I’m no Taylor, but I’ve still overindulged in air travel this year. Going forward, I should look to cut back on trips by plane. In an extreme example of how this might work, Greta Thunberg sailed across the Atlantic to attend a climate conference in a protest against the environmental impact of aviation (although ironically, the sea journey’s logistics included two transatlantic flights). I won’t stop all air travel next year, but smarter choices of seating and substitution of other transportation where possible are viable options. For instance, one easily correctable mistake was flying premium economy on my last trip to London, which roughly doubled my emissions.
- Don’t use the tmap package for animation! This post was also an experiment in animation for me, and I’ve learned that the tmap_animation() function is incredibly finicky. It’s both slow to load (even with a dataset of 23 rows) and difficult to work with. On top of that, the end product comes out slightly pixelated–something I’ve noticed with static images from tmap as well–and some customizations I would have liked, such as a plane icon on the map, remain out of reach. Next time I do something like this, I’ll try assembling a GIF in Adobe instead.
- From a policy standpoint, it’s high time for high-speed rail! It would not only make APDA trips a lot easier (and cheaper), but also slash emissions in the transportation sector.
Ethan Jiang
Dreaming of a world without scarcity.
I am interested in the use of data to inform technology policy and animal welfare.